Dashboard
The Dashboard is the first page after opening ATB — an instant overview of performance.
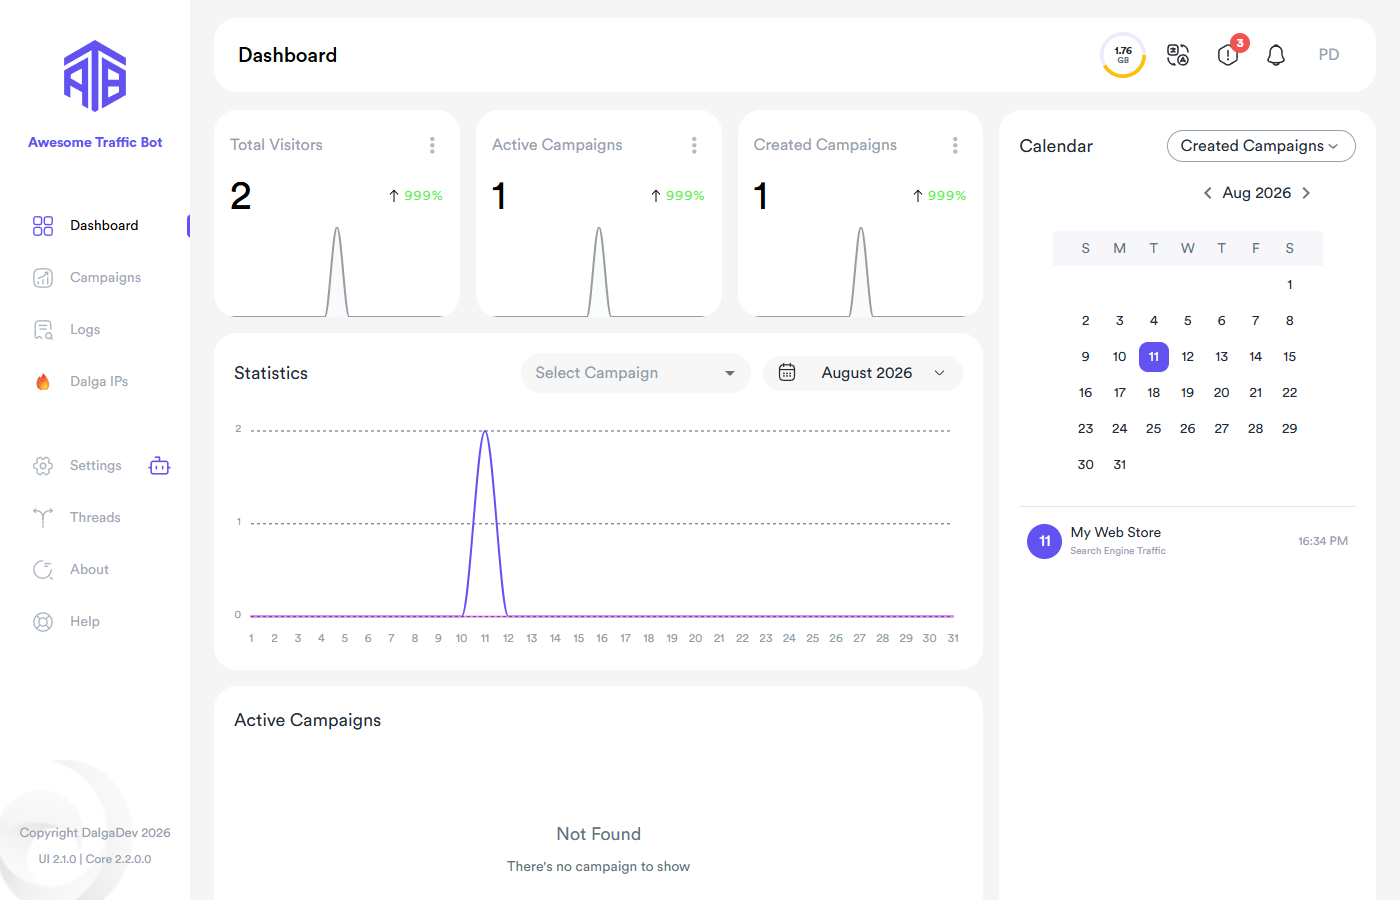
Stat cards
- Total Visitors — visitors sent in the selected month, with the change vs. the previous month.
- Active Campaigns — campaigns that sent at least one visitor that day.
- Created Campaigns — campaigns created per day.
Statistics chart
Detailed daily numbers for the selected month, with a comparison line against the previous month. Filter to a single campaign with Select Campaign, or change the month.
Calendar
Tracks campaign creation dates (switch the metric with the dropdown). Changing the month changes the whole page's statistics.
Active Campaigns table
Campaigns currently able to send visitors, with type, sent visitors, status, and quick actions — the eye icon jumps to the campaign's details.
The header (visible everywhere)
- Bandwidth gauge — remaining Dalga IPs bandwidth.
- Language globe — switch the interface language (English, French, Indonesian, Korean, Spanish, Turkish).
- Update badge — opens the Update Center; the badge counts pending updates.
- Bell — the notification center: updates, messages, change logs, news, and offers. Check it regularly.
- Avatar — your devices and logout.